
 Max 9min read
📝Summary
Field sales KPIs show whether daily field activity actually turns into revenue. This guide lists 15 KPIs across activity, productivity, efficiency, coverage, and outcomes, with a simple formula for the key ones. It also explains how to choose the right KPIs for your goal and track them in a mobile app, so managers can move from scattered reports to clear, timely decisions.
Your field team stays busy all day. Reps check in at outlets, take orders, and file reports by evening. Yet a packed calendar does not always mean a strong sales month. Field activity and sales performance are different.
Field sales KPIs close that gap. They show which visits produce orders, which territories lag, and which reps need support. The right mix covers activity, productivity, efficiency, coverage, and outcomes. A field sales tracking app captures these numbers at the source, so managers stop chasing spreadsheets. This guide covers 15 KPIs, their formulas, and how to track them.
What Are Field Sales KPIs, and Why Should Managers Track Them?
Field sales KPIs are measurable indicators that show how well a field team turns visits into revenue. They track rep activity, order quality, customer coverage, and progress against targets. Managers use them to spot productivity gaps early, compare territories fairly, and coach reps with evidence, not assumptions.
4 Reasons Field Sales Performance Metrics Matter
- They separate effort from results, so busy reps and productive reps no longer look alike.
- They make reviews fair. Every rep gets judged on the same field sales performance metrics.
- They expose problems early. A falling strike rate warns you weeks before revenue drops.
- They guide investment in new reps, routes, or dealer schemes.
Good field sales management starts with numbers everyone trusts.
Which 15 Field Sales KPIs Should Every Manager Measure?
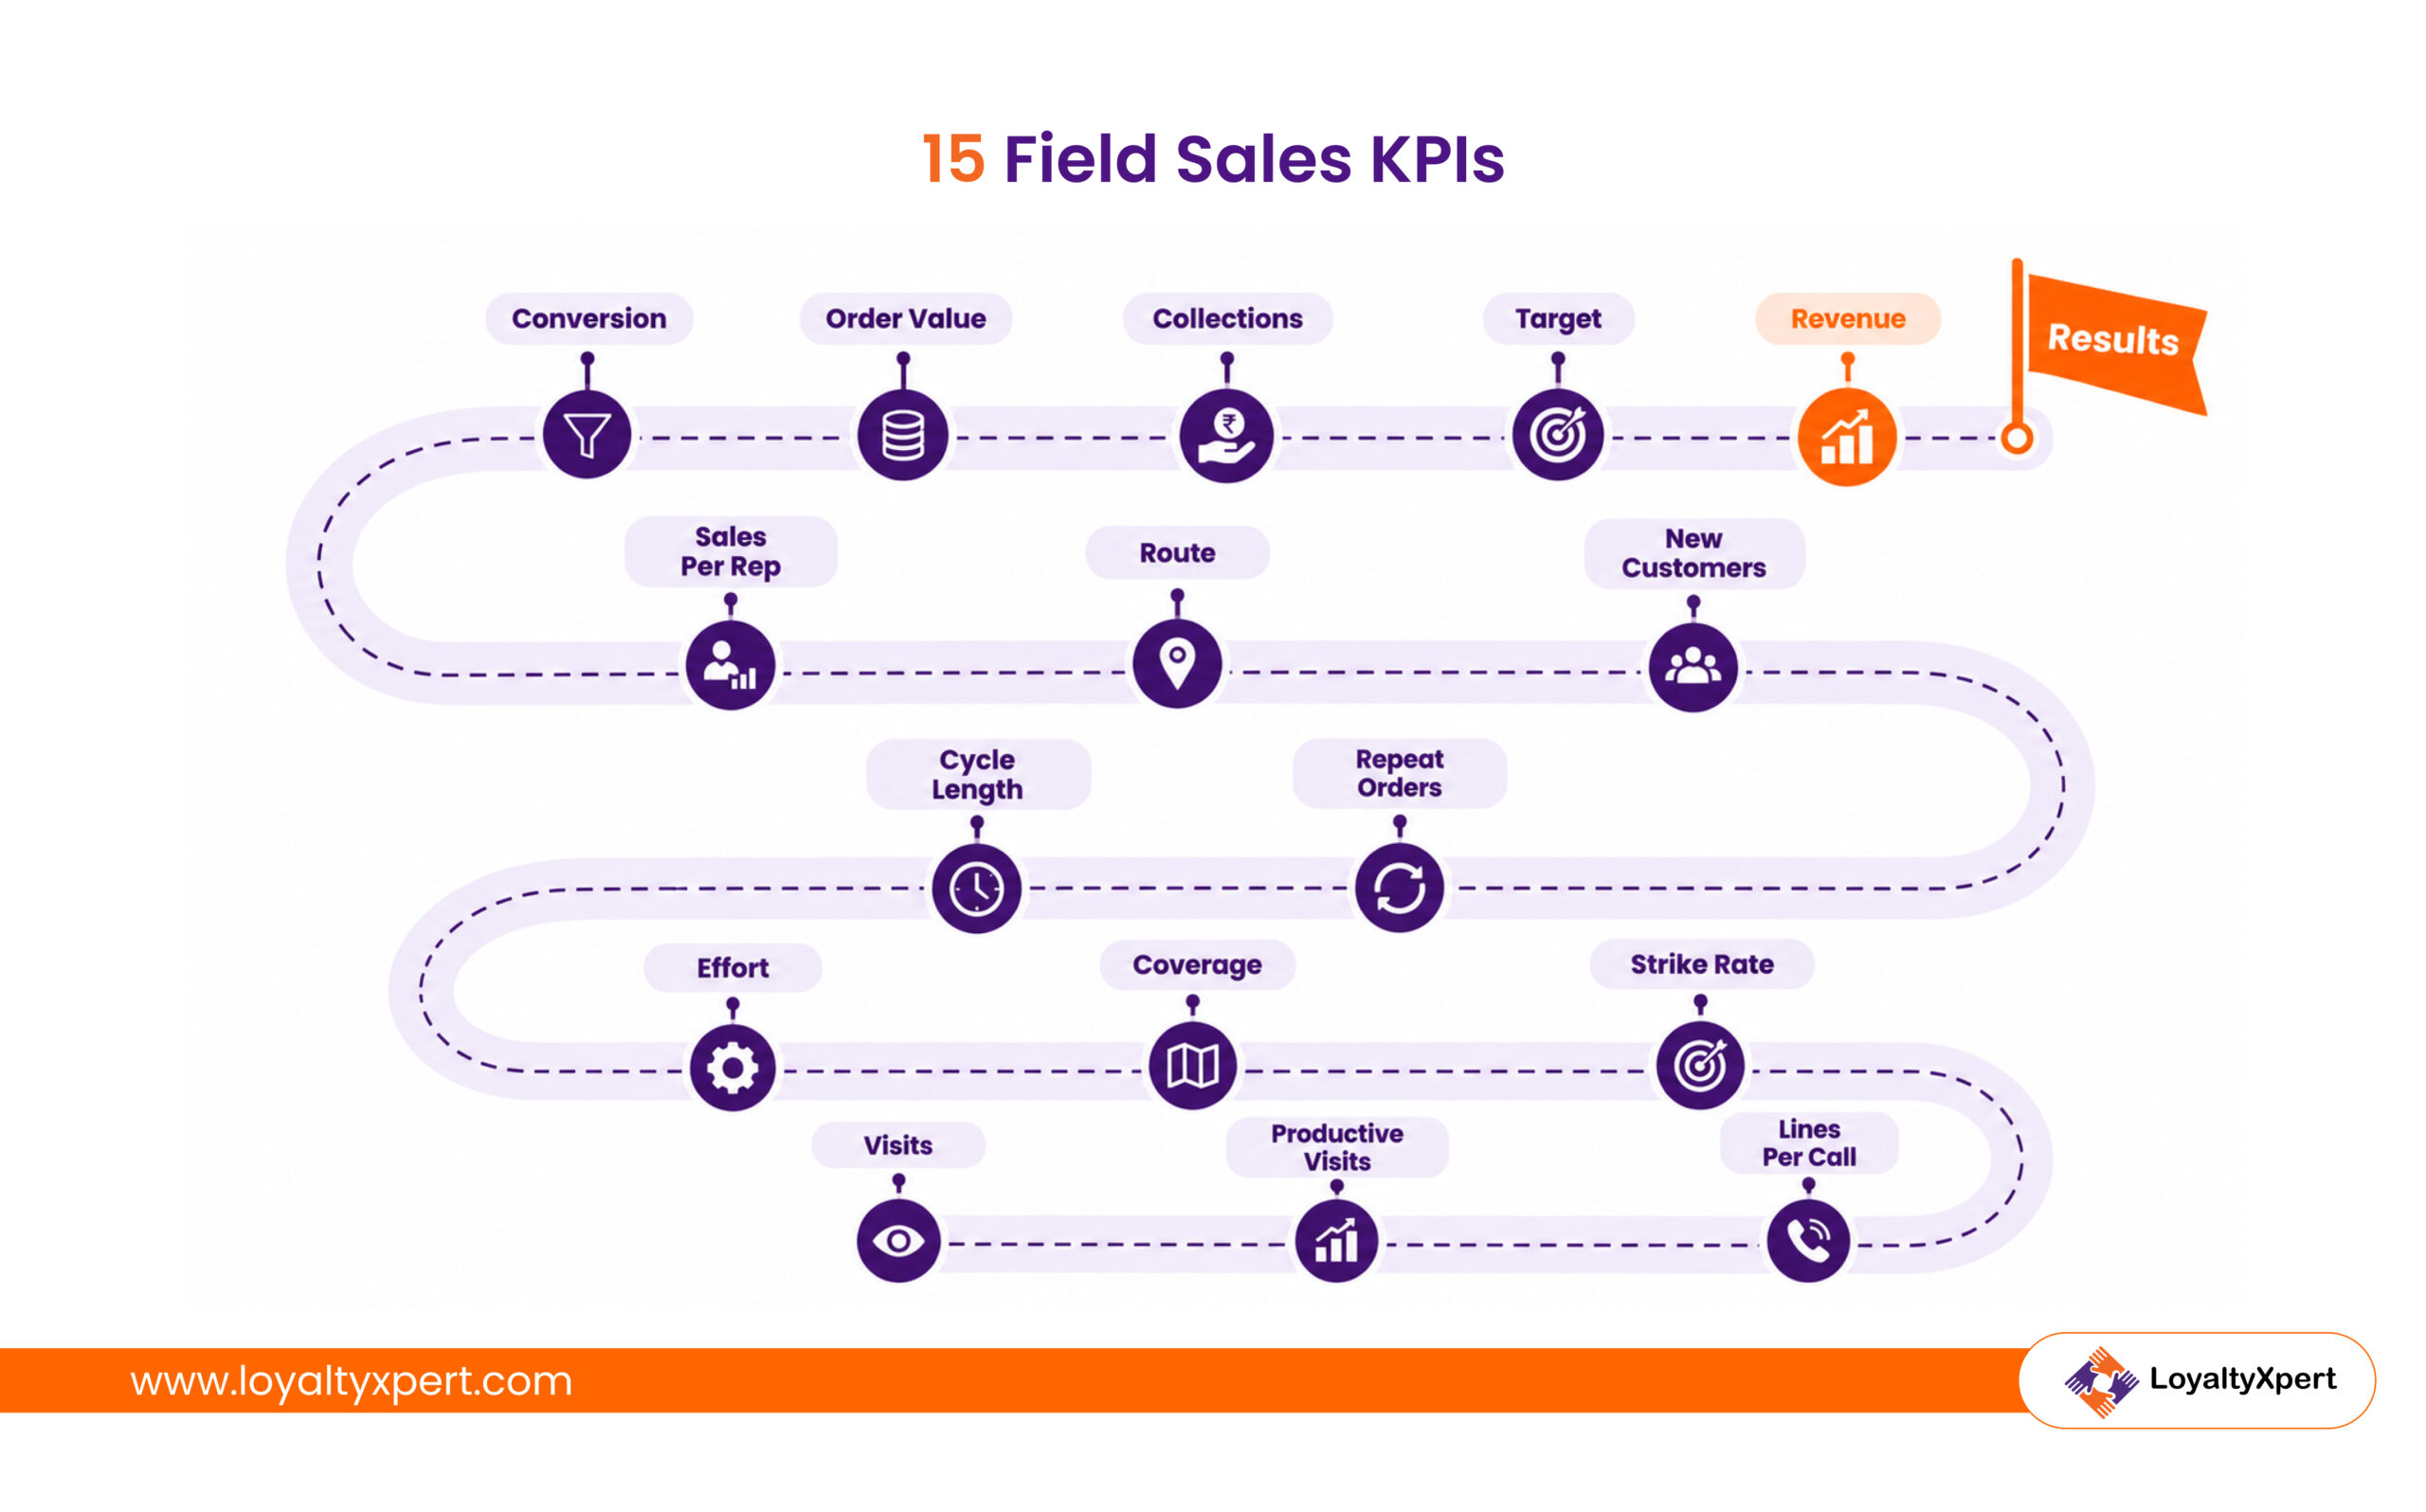
The 15 KPIs every field sales manager should measure span revenue, targets, conversion, visits, order quality, customer growth, coverage, routes, cycle time, and collections. Together, they show what reps do, how well they do it, and what that work earns. Each KPI answers one distinct question.
1. Sales Revenue
Sales revenue is the total value of orders a rep or territory closes in a period.
2. Target Achievement Rate
Target achievement rate compares actual sales against the assigned target. It flags who is off track mid-month.
3. Sales Conversion Rate
Sales conversion rate measures the share of opportunities that become closed orders. A low rate often points to weak pitching.
4. Customer Visits Completed
Customer visits completed counts the planned visits a rep actually makes. A field sales tracking app checks it against the beat plan.
5. Productive Visits
Productive visits are visits that end in an order, a collection, or a confirmed next step. Field sales tracking separates them from courtesy calls.
6. Strike Rate
Strike rate is the percentage of total visits that produce an order.
7. Lines Per Call
Lines per call is the average number of distinct SKUs in each order. Higher numbers mean reps sell a wider range.
8. Average Order Value
Average order value shows the typical size of each order. Rising values signal successful upselling.
9. New Customers Acquired
New customers acquired tracks first-time buyers a rep onboards.
10. Repeat Order Rate
Repeat order rate shows how many customers reorder within a set period. It reflects relationship strength on the ground.
11. Sales Per Representative
Sales per representative divides team revenue by active reps.
12. Customer Coverage
Customer coverage measures the share of assigned accounts a rep visits in a cycle. A field sales tracking app flags accounts nobody visited.
13. Route Productivity
Route productivity links revenue to the time or distance spent on a route. Route data from sales tracking software shows which beats need a redesign.
14. Sales Cycle Length
Sales cycle length measures the average days from first visit to first order.
15. Collection Efficiency
Collection efficiency compares payments collected against amounts due. Strong sales mean little if dealer dues keep piling up.
How Do You Group Field Sales KPIs by Category?
Field sales KPIs fall into five categories: activity, productivity, efficiency, coverage, and outcome. Activity KPIs show effort, while productivity and efficiency KPIs show how well reps use it. Coverage KPIs show market reach, and outcome KPIs show results. Balanced field sales tracking needs at least one KPI from each group.
| Category | KPIs Included | Question It Answers |
|---|---|---|
| Activity | Customer visits completed | Are reps in the field as planned? |
| Productivity | Productive visits, strike rate, lines per call, sales per representative | Does each visit produce business? |
| Efficiency | Route productivity, sales cycle length | Are time and travel well used? |
| Coverage | Customer coverage, new customers acquired, repeat order rate | Are we reaching and keeping the market? |
| Outcome | Sales revenue, target achievement, conversion rate, average order value, collection efficiencies | What did the effort earn? |
Sales performance tracking should read the groups together. High activity with low productivity signals a need for coaching.
Which Field Sales KPIs Should Managers Prioritize First?
Managers should prioritize the field sales performance metrics tied to their current goal, not every metric available. A team chasing coverage needs different numbers than a team chasing order size. Three to five focus KPIs keep reviews sharp and give reps a clear picture of success.
3 Steps to Choose Your Focus KPIs
- Name one business goal for the quarter, such as wider coverage or larger orders.
- Pick the outcome KPI that proves progress on that goal.
- Add two or three supporting KPIs that explain why the outcome moves.
A paint brand launching new SKUs might watch lines per call and order value. A cement distributor entering new districts would watch coverage and new customers. Either way, field sales management improves when everyone knows which numbers matter.
How Do You Calculate the Most Important Field Sales Performance Metrics?
Field sales performance metrics use simple ratios built from visit, order, and payment data. Most formulas divide a result by an effort, such as orders by visits or revenue by reps. An incorrect visit count produces an incorrect strike rate, no matter which formula you use.
| KPI | Formula | Illustrative Example |
|---|---|---|
| Target Achievement Rate | (Actual Sales ÷ Sales Target) × 100 | ₹8 lakh ÷ ₹10 lakh = 80% |
| Strike Rate | (Visits With Orders ÷ Total Visits) × 100 | 36 ÷ 60 = 60% |
| Average Order Value | Total Order Value ÷ Number of Orders | ₹4.5 lakh ÷ 90 = ₹5,000 |
| Lines Per Call | Total SKU Lines Ordered ÷ Productive Visits | 180 ÷ 45 = 4 |
| Customer Coverage | (Accounts Visited ÷ Assigned Accounts) × 100 | 170 ÷ 200 = 85% |
| Repeat Order Rate | (Reordering Customers ÷ Total Customers) × 100 | 120 ÷ 150 = 80% |
| Collection Efficiency | (Amount Collected ÷ Amount Due) × 100 | ₹6 lakh ÷ ₹7.5 lakh = 80% |
Most sales tracking software calculates these automatically. Still, run each formula on the same period for every rep.
What Makes Field Sales KPIs Hard to Track?
Field sales tracking becomes hard when field data is incomplete, unverified, or reported differently by each rep. Managers then see what reps report, not what actually happened. Missing visits and backdated entries quietly distort every KPI built on that data.
- Incomplete visit data makes customer coverage look better or worse than reality.
- Unverified visits weaken sales performance tracking.
- Inconsistent report formats make rep-to-rep comparison unreliable.
- Delayed DSRs push corrective action into the next month.
- Disconnected order and payment records break collection tracking.
Choosing the right field sales tracking software fixes most of these issues, because reps record facts on the spot. Generic sales tracking software rarely verifies visit locations, a gap field sales management cannot ignore.
Discover Better Ways to Measure Sales Performance
How Does Real-Time Sales Tracking Make KPI Measurement Easier?
Real-time sales tracking makes KPI measurement easier by recording each visit, order, and location the moment it happens. GPS check-ins verify presence. Digital order forms feed revenue and lines per call directly. Dashboards then calculate every KPI automatically, so field sales management runs on live numbers.
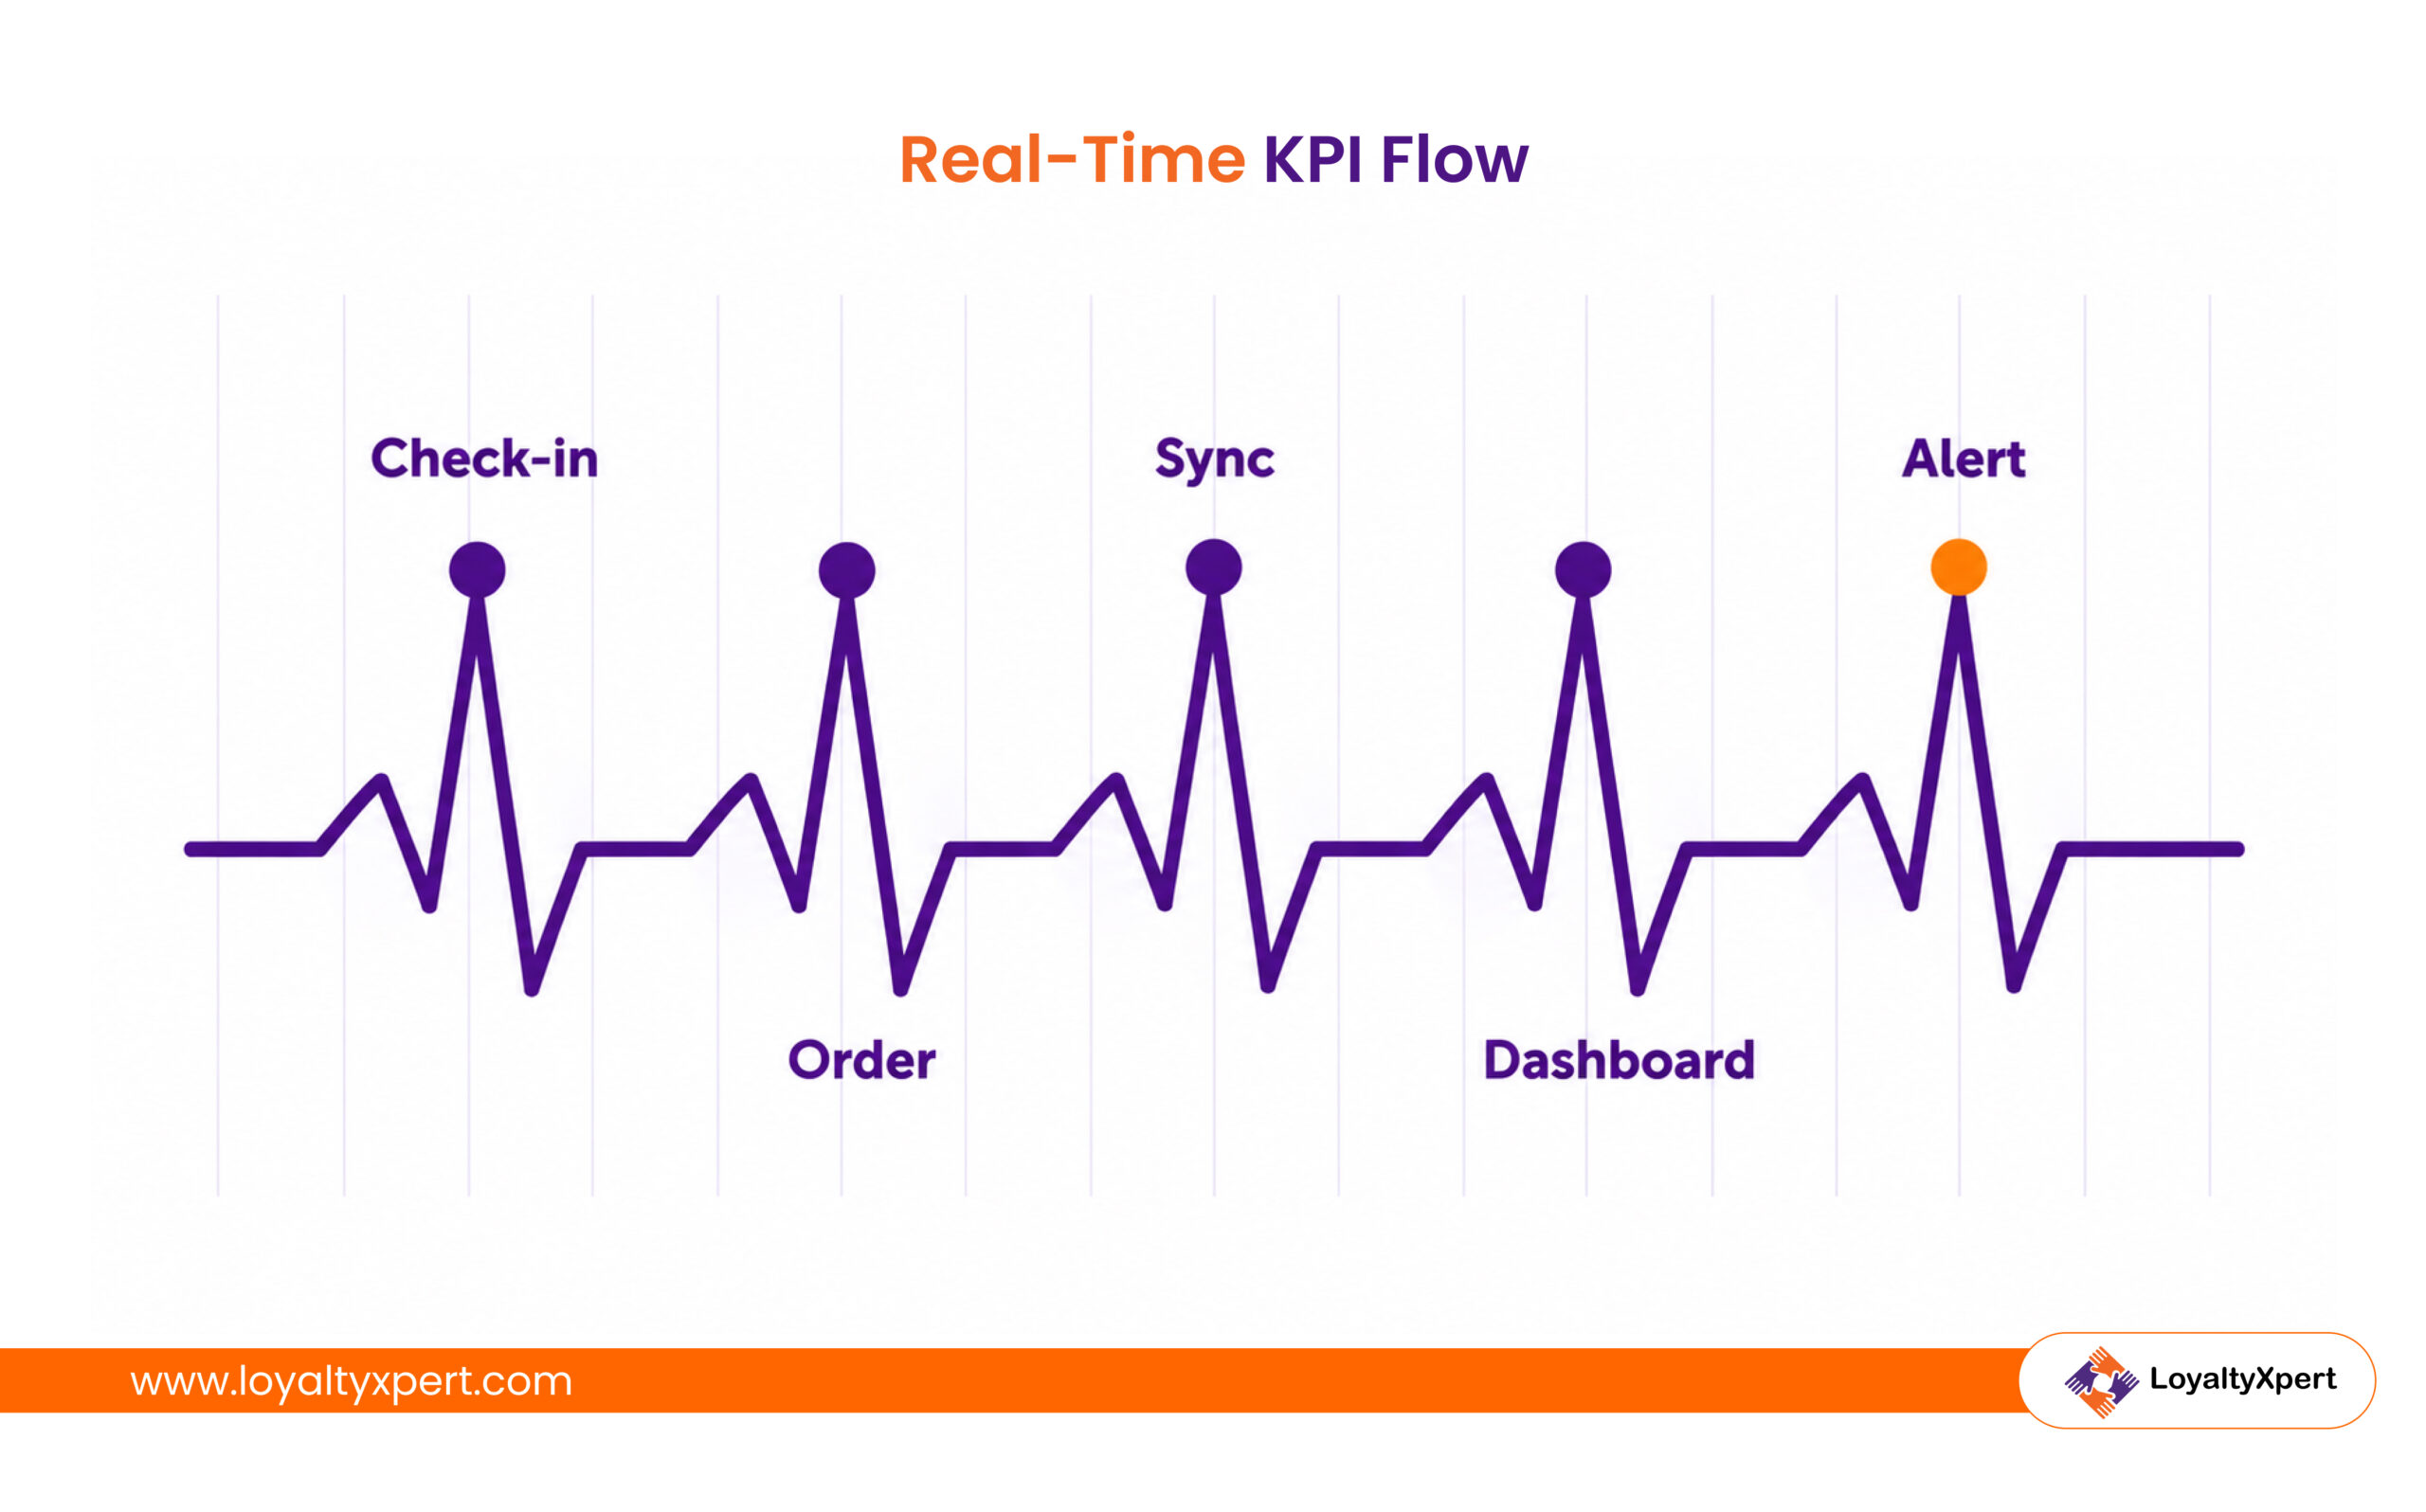
Here is how data moves through a field sales tracking app:
- The rep checks in at the outlet with a GPS-stamped visit.
- The rep logs the order, collection, or visit outcome.
- The sales tracking software syncs data to a central dashboard, even offline.
- The dashboard updates strike rate, coverage, and target progress in real time.
- Managers get alerts when a KPI drops below its threshold.
A well-built sales tracking app also lifts most of the reporting burden off reps. Sales performance tracking then becomes a by-product of daily work, and field sales tracking stops being an extra task.
How Do You Track Field Sales KPIs Accurately?
Field sales tracking works best with a mobile app that records visits, orders, and locations in real time. Manual methods like Excel sheets and daily sales reports (DSRs) depend on rep memory and arrive late. A field sales tracking app gives managers verified data the same day, not the following week.
Manual reporting also eats into selling time. Salesforce’s sixth State of Sales report (2024) found admin work and other duties outside selling absorb 70% of a rep’s working hours.
| Factor | Manual Tracking (Excel, DSRs) | Field Sales Tracking App |
|---|---|---|
| Data Timing | End of day or week | As each visit happens |
| Visit Proof | The rep’s word | GPS check-in with time stamp |
| Accuracy | Prone to typos and gaps | Captured at the source |
| Manager Effort | Hours of consolidation | Dashboards build themselves |
| KPI Freshness | Last week’s picture | Live view |
Teams moving off spreadsheets should compare the best sales tracking software on offline mode, GPS accuracy, and order capture. Strong sales performance tracking depends on that choice.
How Can Managers Turn Field Sales KPI Data Into Better Decisions?
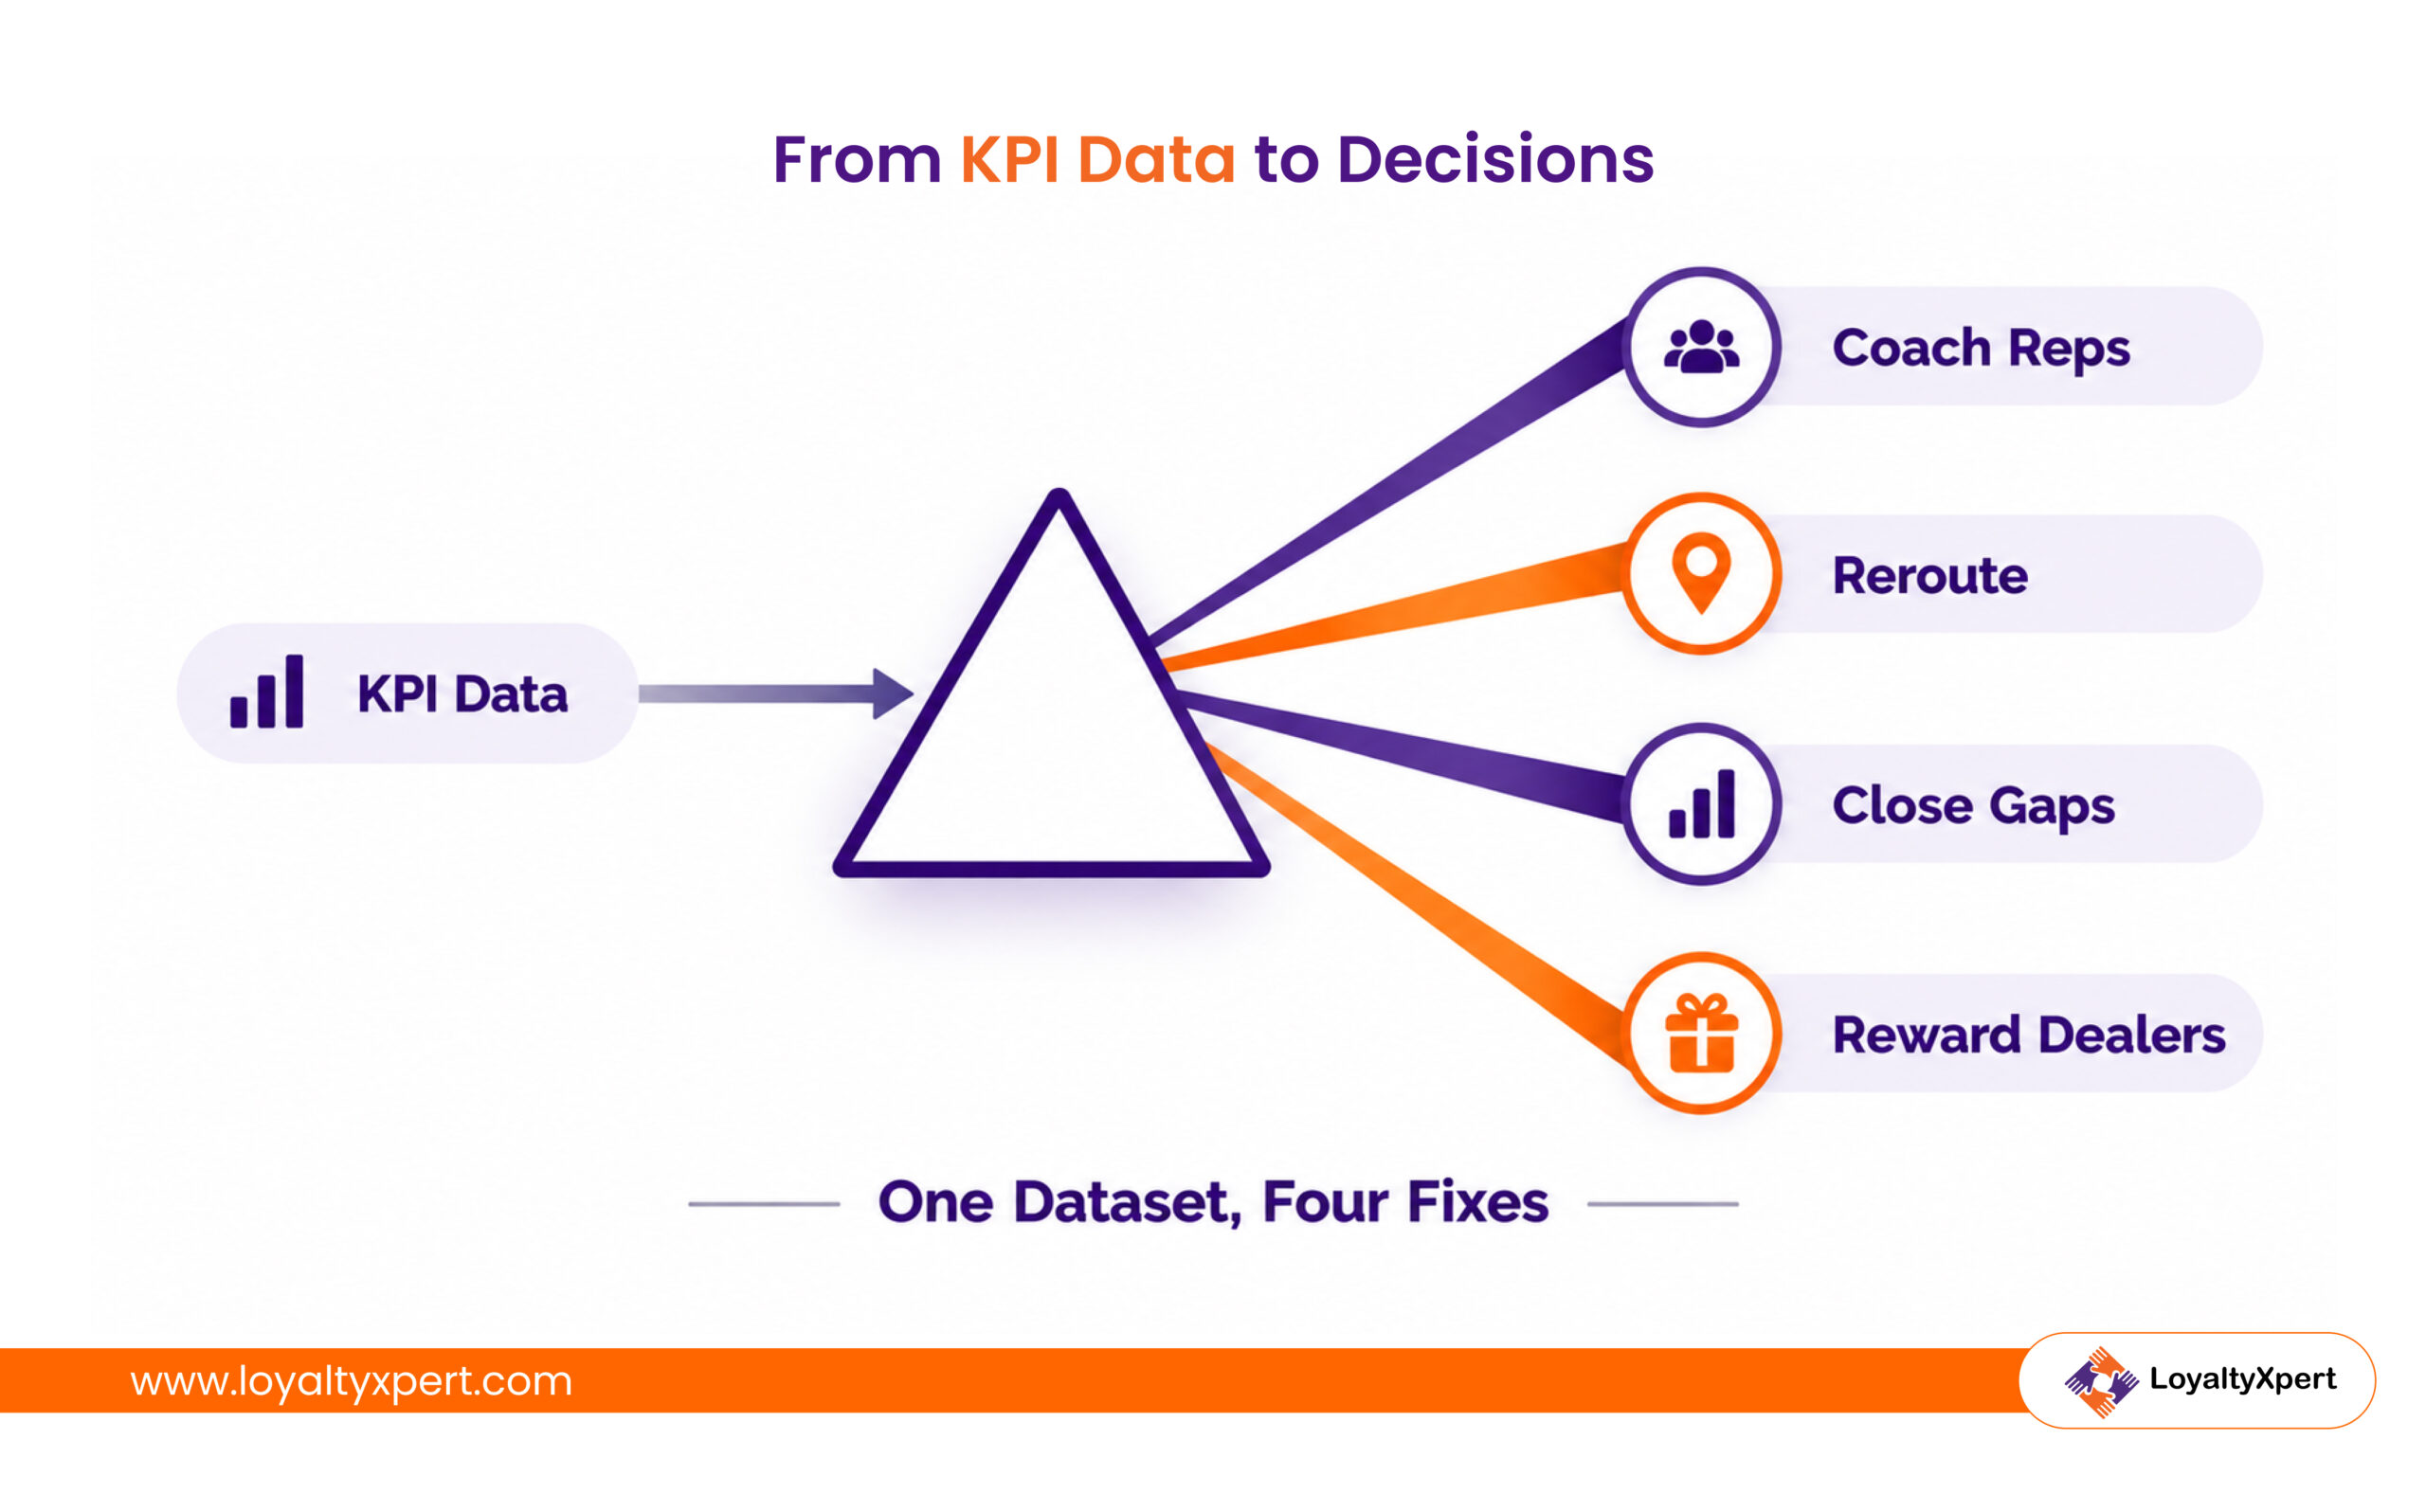
Sales performance tracking leads to better decisions when managers read patterns across reps, territories, and time. Combined field sales performance metrics reveal root causes, such as poor routes, weak pitching, or neglected accounts. Each cause then points to a specific fix.
Coach Reps With Specific Evidence
High visits with a low strike rate usually signal a pitching issue. Pair that rep with a top performer for joint calls.
Redesign Routes That Waste Time
Low route productivity often means outlets are scattered. Cluster visits by area and drop stops that rarely order.
Close Coverage Gaps Before Competitors Do
Falling coverage leaves dealers unattended, so reassign accounts or add a beat.
Reward Dealers Who Keep Reordering
Repeat order rate climbs when dealers feel valued. Connecting field data with dealer reward programs lets you recognize loyal accounts.
For manufacturers, these decisions work best when field sales management connects field data with dealer and distributor records. A field sales tracking app then feeds territory plans, coaching, and dealer reward programs in one cycle.
Which Field Sales KPIs Will Move Your Numbers?
Field sales KPIs only help when they reflect what really happens in the field. Start with the few that match your goal, and track them through a field sales tracking app. Then use sales performance tracking to coach, reroute, and reward.
LoyaltyXpert brings visits, orders, and KPI dashboards into one live view for field sales management. Choose your next step:
- Contact Us — Talk to our team about your field sales tracking needs.
- Explore the Sales Tracking App — Review GPS check-ins, order capture, and reporting features.
- Become a Partner — Bring LoyaltyXpert to your clients and channel network.