 Max 9min read
📝 Summary
Warranty claims carry more than repair costs. They also show how products fail. Warranty Management Reports turn that evidence into direction. This guide explains what these reports contain. It shows how claim patterns expose recurring defects. It also lists the Warranty Management Reports manufacturers should track monthly. By the end, you will understand how warranty reports improve product quality across design, production, and service.
Most manufacturers treat warranty as a cost line. Claims arrive, teams process them, money goes out, and the cycle repeats next quarter. It works well enough. It also wastes the most honest data a manufacturer will ever receive.
Warranty claims describe real failures in real conditions. No lab test matches that. A customer in humid coastal air stresses your product one way; a dealer in a dusty industrial belt stresses it another. Every claim quietly records that reality but only if someone is reading it.
That’s where warranty management reports come in. Manufacturers running structured warranty management software don’t just log claims, they turn them into reports that surface failure signals, not just expenses. This blog explains how that shift happens.
What Is Warranty Management?
Warranty management is a structured post-sale process. It covers registration, claims, validation, and repair. Manufacturers use it to control warranty costs. The process also records every product failure. That record becomes the reporting foundation. Warranty management creates the data reports need.
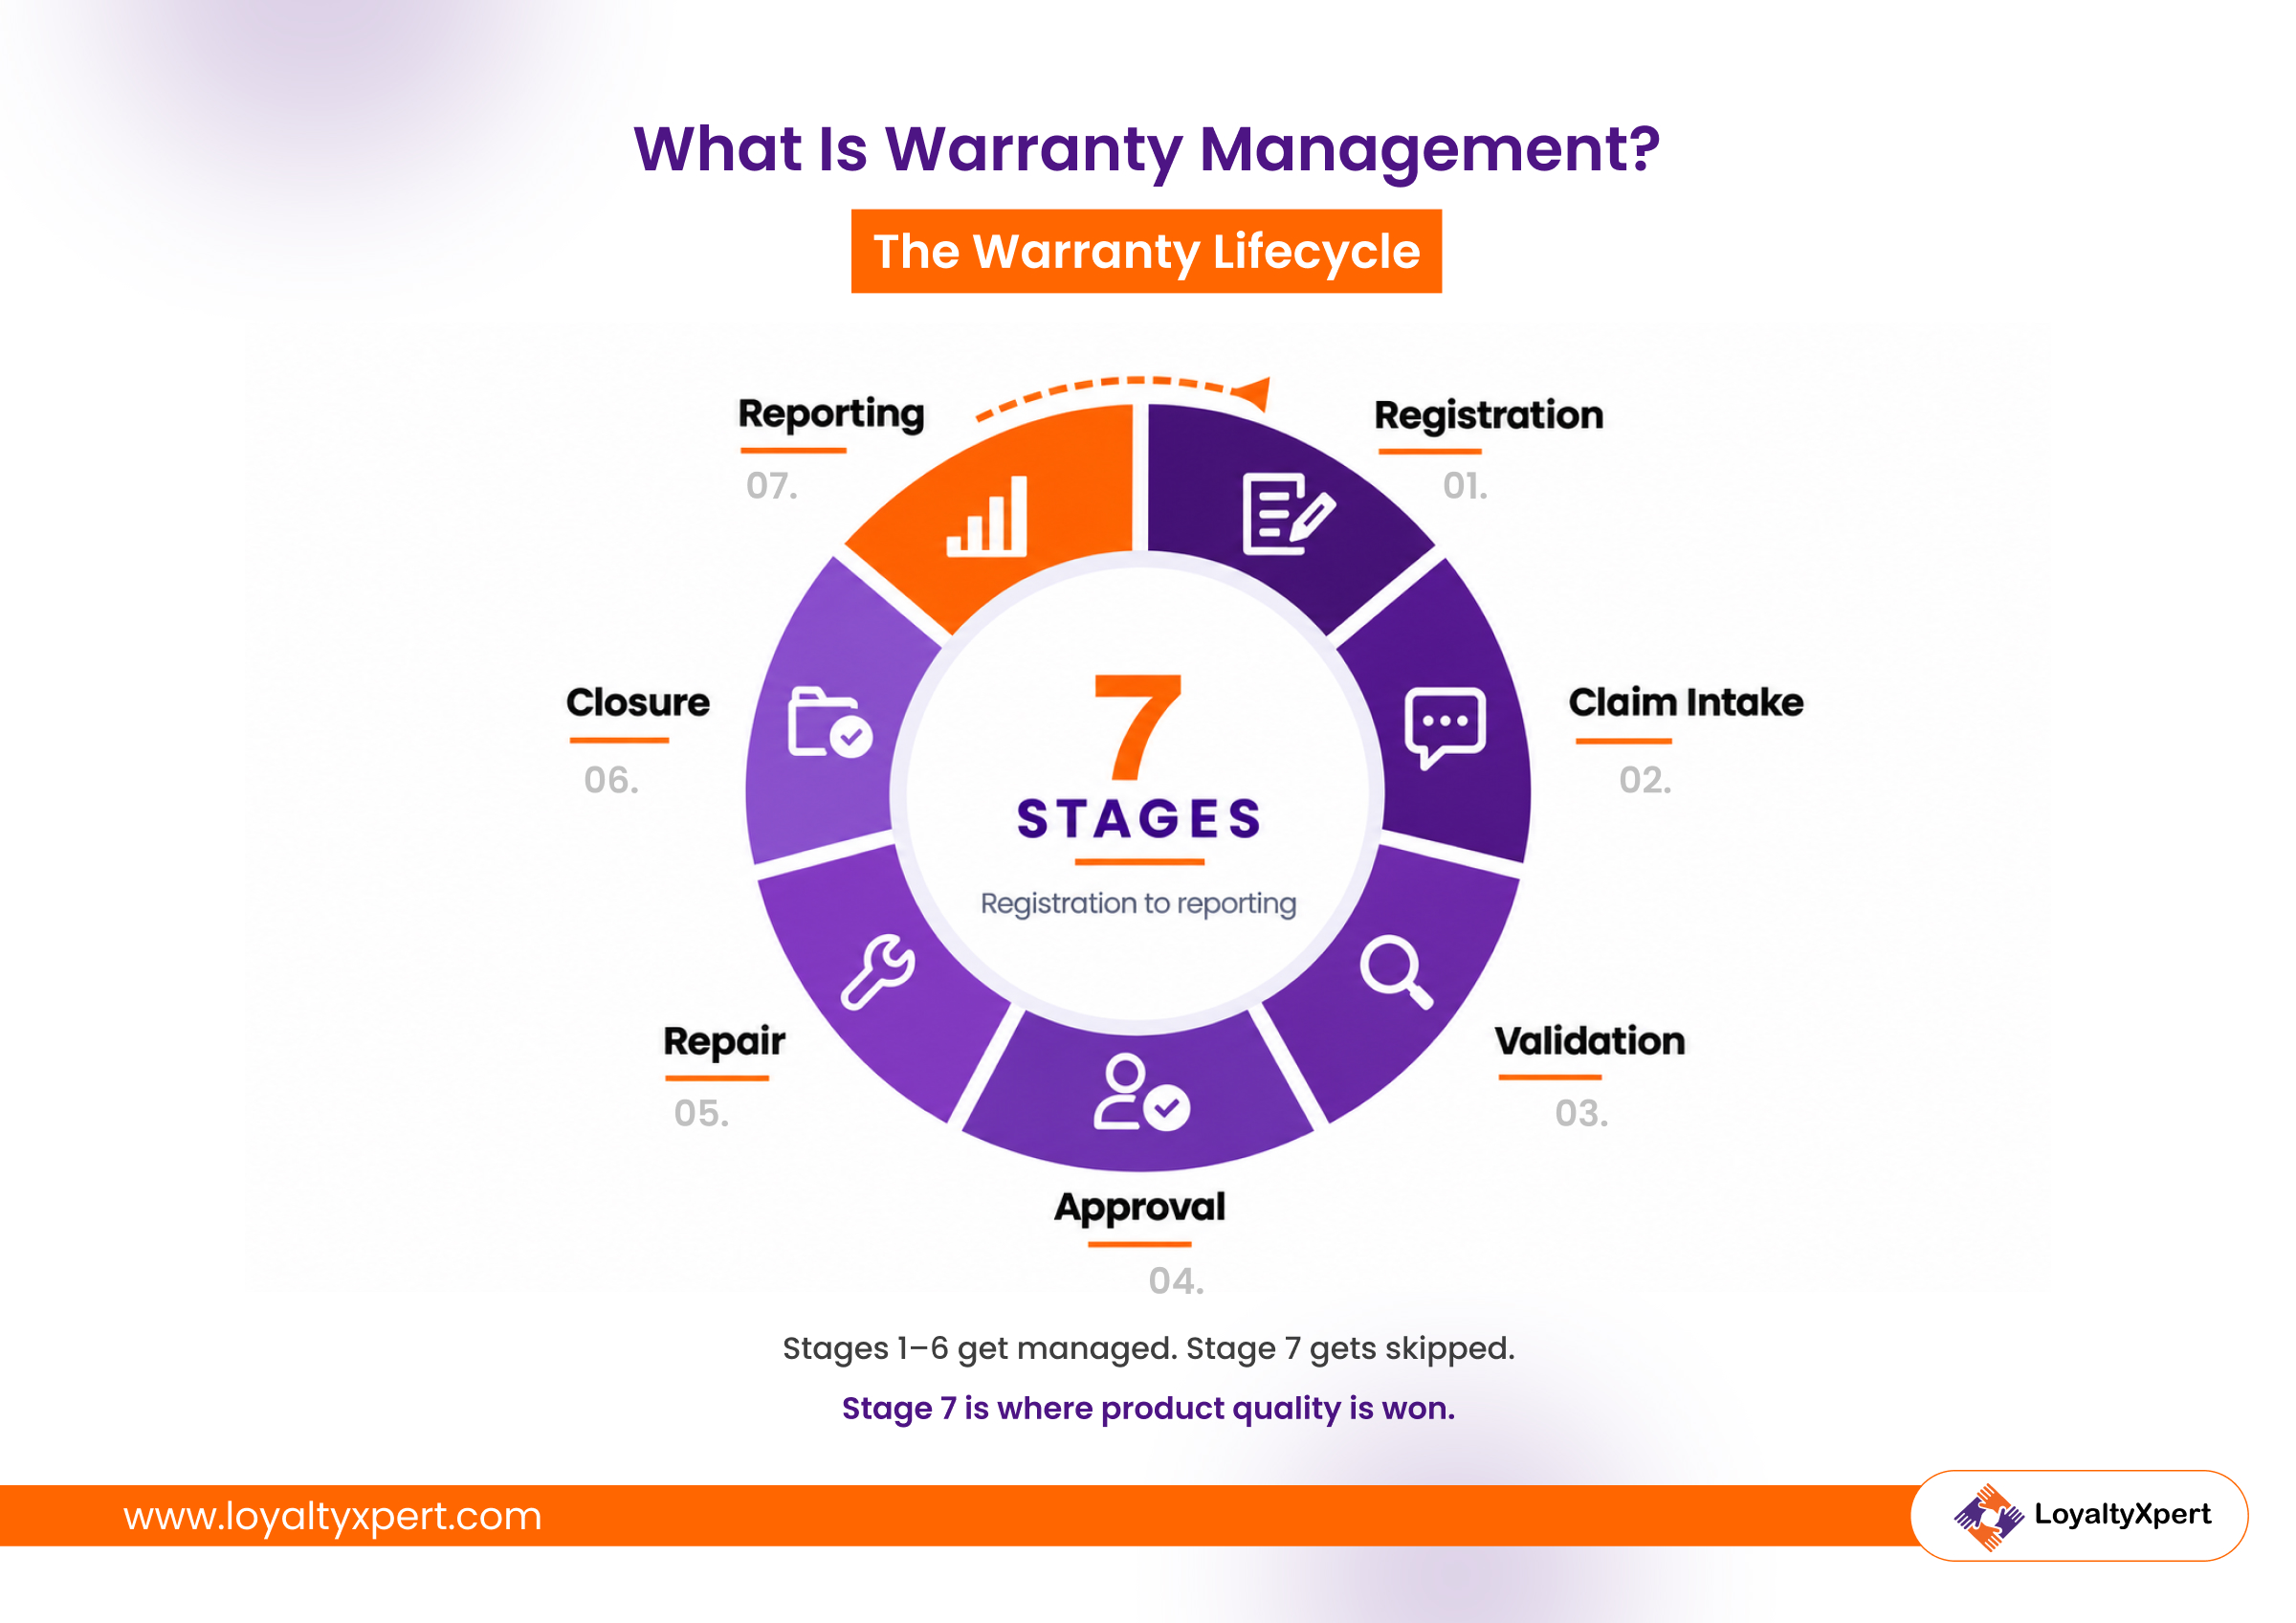 The lifecycle runs in a fixed sequence.
The 7 Stages Of The Warranty Lifecycle
- Registration — The dealer or customer records the purchase, serial number, and date.
- Claim Intake — The partner reports a failure with defect details and supporting proof.
- Validation — The system checks coverage, warranty period, and claim authenticity.
- Approval or Rejection — Your team clears the claim or logs a reason for declining it.
- Repair or Replacement — Service teams repair, swap, or credit the product.
- Closure — The system records cost, turnaround time, and final resolution.
- Reporting — Aggregated claim data becomes Warranty Management Reports.
Most manufacturers manage the first six stages well. The seventh stage gets neglected. That neglect is the real problem. Claims get settled, then the data dies. Nobody asks what the claims meant.
A warranty management system preserves that stage. It stores every claim in queryable form. Product warranty management software then generates reports. Reporting stops being a manual chore.
Turn settled claims into quality insight
Warranty Management vs Warranty Management Reports
Warranty management is the operational process. Warranty Management Reports are the analytical output. One settles claims efficiently. The other prevents them entirely. Manufacturers need both working together because a warranty management system without reporting only tells you what you spent.
What Are Warranty Management Reports?
Warranty Management Reports summarize post-sale claim data. They track failures, costs, and repair timelines. Manufacturers read them to judge product performance. The reports turn scattered service records into visible patterns. Quality teams then trace defects to specific batches. Post-sale data becomes an early warning signal.
A basic report set usually covers four layers:
| Report Layer | What It Captures | Primary User |
|---|---|---|
| Claim Volume | Number of claims filed per period | Service and finance |
| Failure Detail | Component, defect type, failure mode | Quality and R&D |
| Cost Detail | Parts, labor, logistics, goodwill spend | Finance |
| Resolution Detail | Approval time, turnaround, rejection reasons | Operations |
Each layer answers a different business question. Together they describe product health honestly. Manufacturers using warranty management features inside a loyalty app capture this data at registration itself.
What Does Warranty Data Reveal About Product Performance?
Warranty data reveals where products fail first. It exposes weak components, faulty batches, and stressed regions. Claim records name the exact part involved.
Timestamps show how quickly failures appear. Location fields highlight climate and handling effects. Model fields separate design flaws from production defects. Nothing else gives manufacturers this precision.
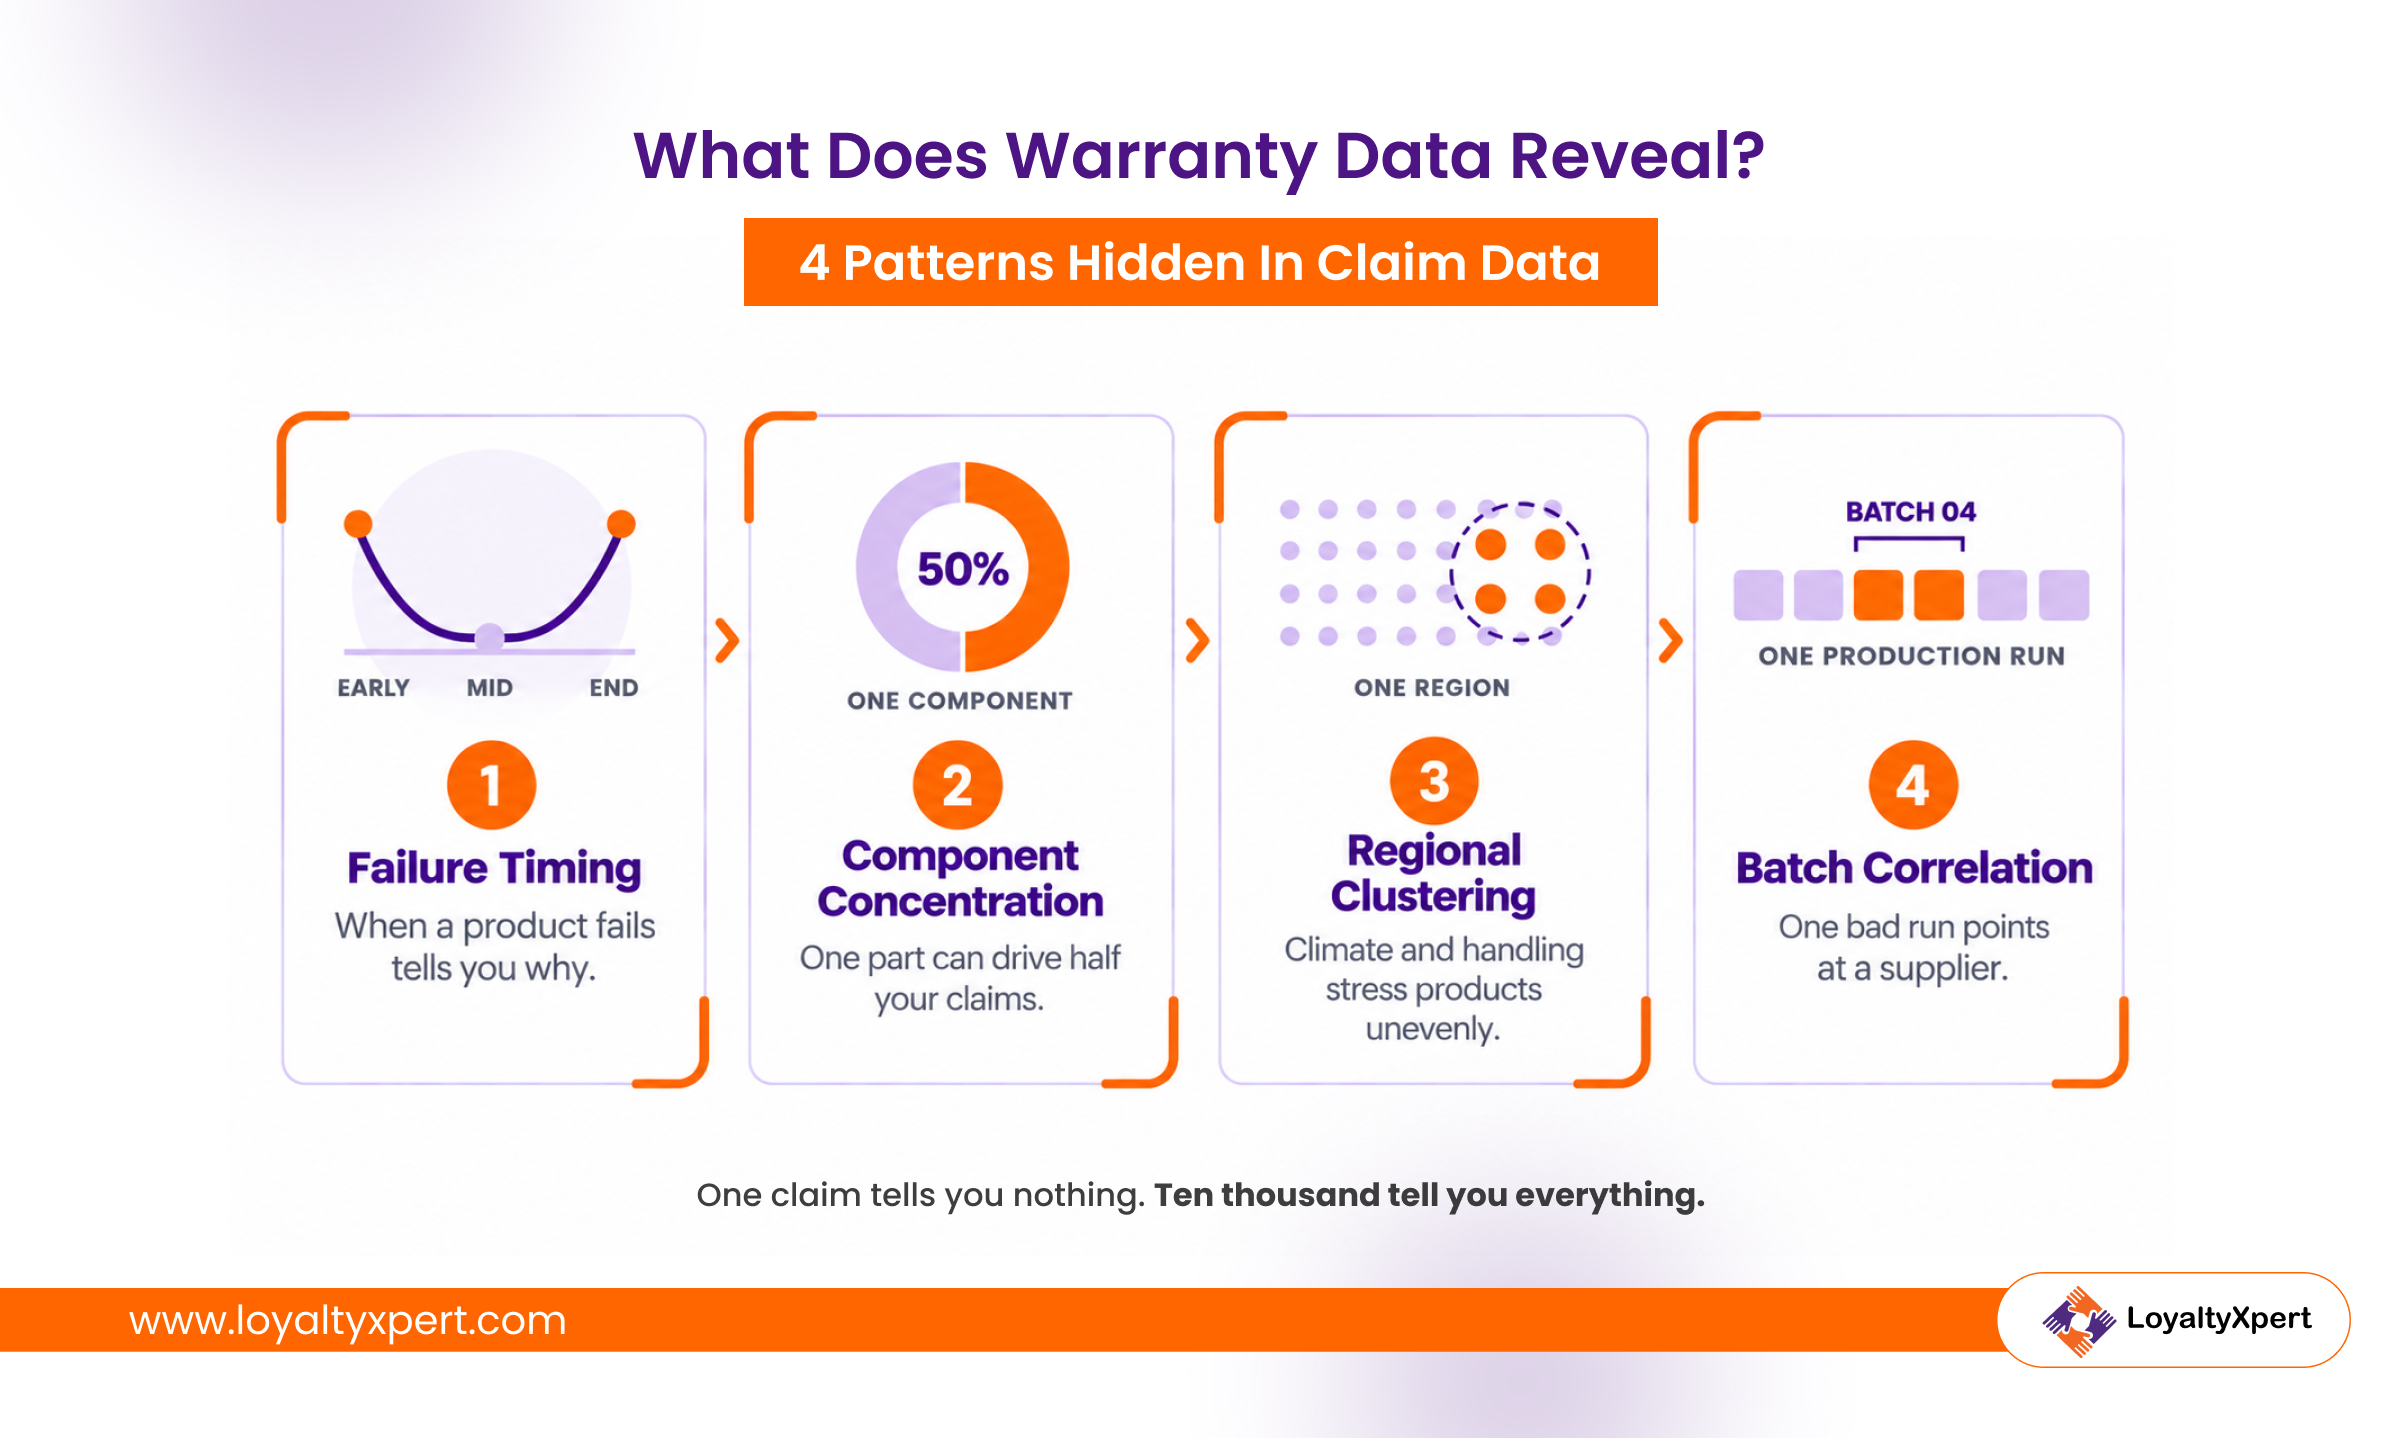
Four patterns matter most:
Failure Timing
Early-life claims point to assembly errors. Mid-life claims suggest material fatigue. End-of-warranty spikes indicate design limits.
Component Concentration
One part may drive half your claims. That concentration is a design brief.
Regional Clustering
Claims cluster where conditions turn extreme. Coastal humidity corrodes. Dust clogs. Voltage swings damage. Each region then needs its own fix, not one global change.
Batch Correlation
Claims tied to one production run signal supplier problems. The fix is procurement, not engineering. Tighter incoming inspection often closes the gap quickly.
None of these patterns are visible in a single claim file. Warranty Management Reports make them visible by aggregating thousands of claims into one view, which is exactly what dedicated warranty management software is built to do.
How Do Warranty Reports Help Identify Recurring Product Issues?
Warranty reports identify recurring issues through pattern frequency. The system groups claims by defect code and model. Repeated codes rise to the top automatically. Quality teams then compare frequency against production volume. A rising ratio confirms a real defect. Manual spreadsheets miss this signal for months. Structured reporting catches it in weeks.
4 Signals That Expose A Recurring Defect:
- The Same Defect Code Repeats-One code dominates claims across dealers. That repetition is rarely coincidence.
- Failure Time Shortens-Products start failing earlier than before. Something changed upstream in production.
- Claims Concentrate In One Model-Other models stay stable. The problem is model-specific, not systemic.
- Rejection Rates Fall Sharply-Fewer claims get rejected as invalid. The failures are genuine and reproducible.
Any one of these signals can look like noise on its own. When two or three appear together, the pattern is real, and quality teams should open a formal investigation.
Most manufacturers already sit on this data. They simply cannot read it. Slow approvals and scattered paperwork hide the signal, and those warranty claim management challenges compound quietly until a defect becomes a recall.
Warranty tracking software removes that delay. Catching a defect in week three instead of month nine is, in practical terms, how warranty reports improve product quality before customers ever notice a pattern.
How Does Warranty Tracking Software Turn Claims Data Into Quality Insights?
Warranty tracking software standardizes how claims get recorded. It enforces fixed fields for defects and components. Clean input makes reliable analysis possible. The software then aggregates claims automatically across dealers. Dashboards surface failure rates without manual effort. Quality teams receive patterns, not paperwork. Insight replaces guesswork.
The difference shows clearly in practice:
| Without Structured Software | With Warranty Tracking Software |
|---|---|
| Free-text defect notes | Standardized defect codes |
| Dealer-wise Excel files | Single unified claim database |
| Monthly manual compilation | Real-time dashboards |
| Defects found after recalls | Defects flagged within weeks |
| No batch traceability | Serial and batch linked claims |
Data quality decides insight quality. Product warranty management software enforces that quality at entry. Every claim carries a serial number, purchase date, and defect code. That structure makes analytics trustworthy.
Not every platform handles this equally well. A standalone warranty tool keeps claim data isolated, while loyalty management software for manufacturers with built-in warranty tracking keeps claims, dealers, and sales in one place.
How Do Warranty Management Reports Support Better Product Design?
Warranty Management Reports support design by ranking real-world failures. Engineers see which components fail most often. They also see how fast failures occur. Reports connect defects to materials and suppliers. Design teams then revise tolerances, materials, or assembly steps. Field evidence replaces assumptions in design reviews. Products improve version after version.
The financial case for acting on this data is straightforward. Warranty Week’s 23rd Annual Product Warranty Report, published in April 2026, put the 2025 average warranty accrual rate at 1.43% of product sales, with the 23-year average claims rate holding at 1.42%. That is a permanent line on the P&L, and design decisions are what move it.
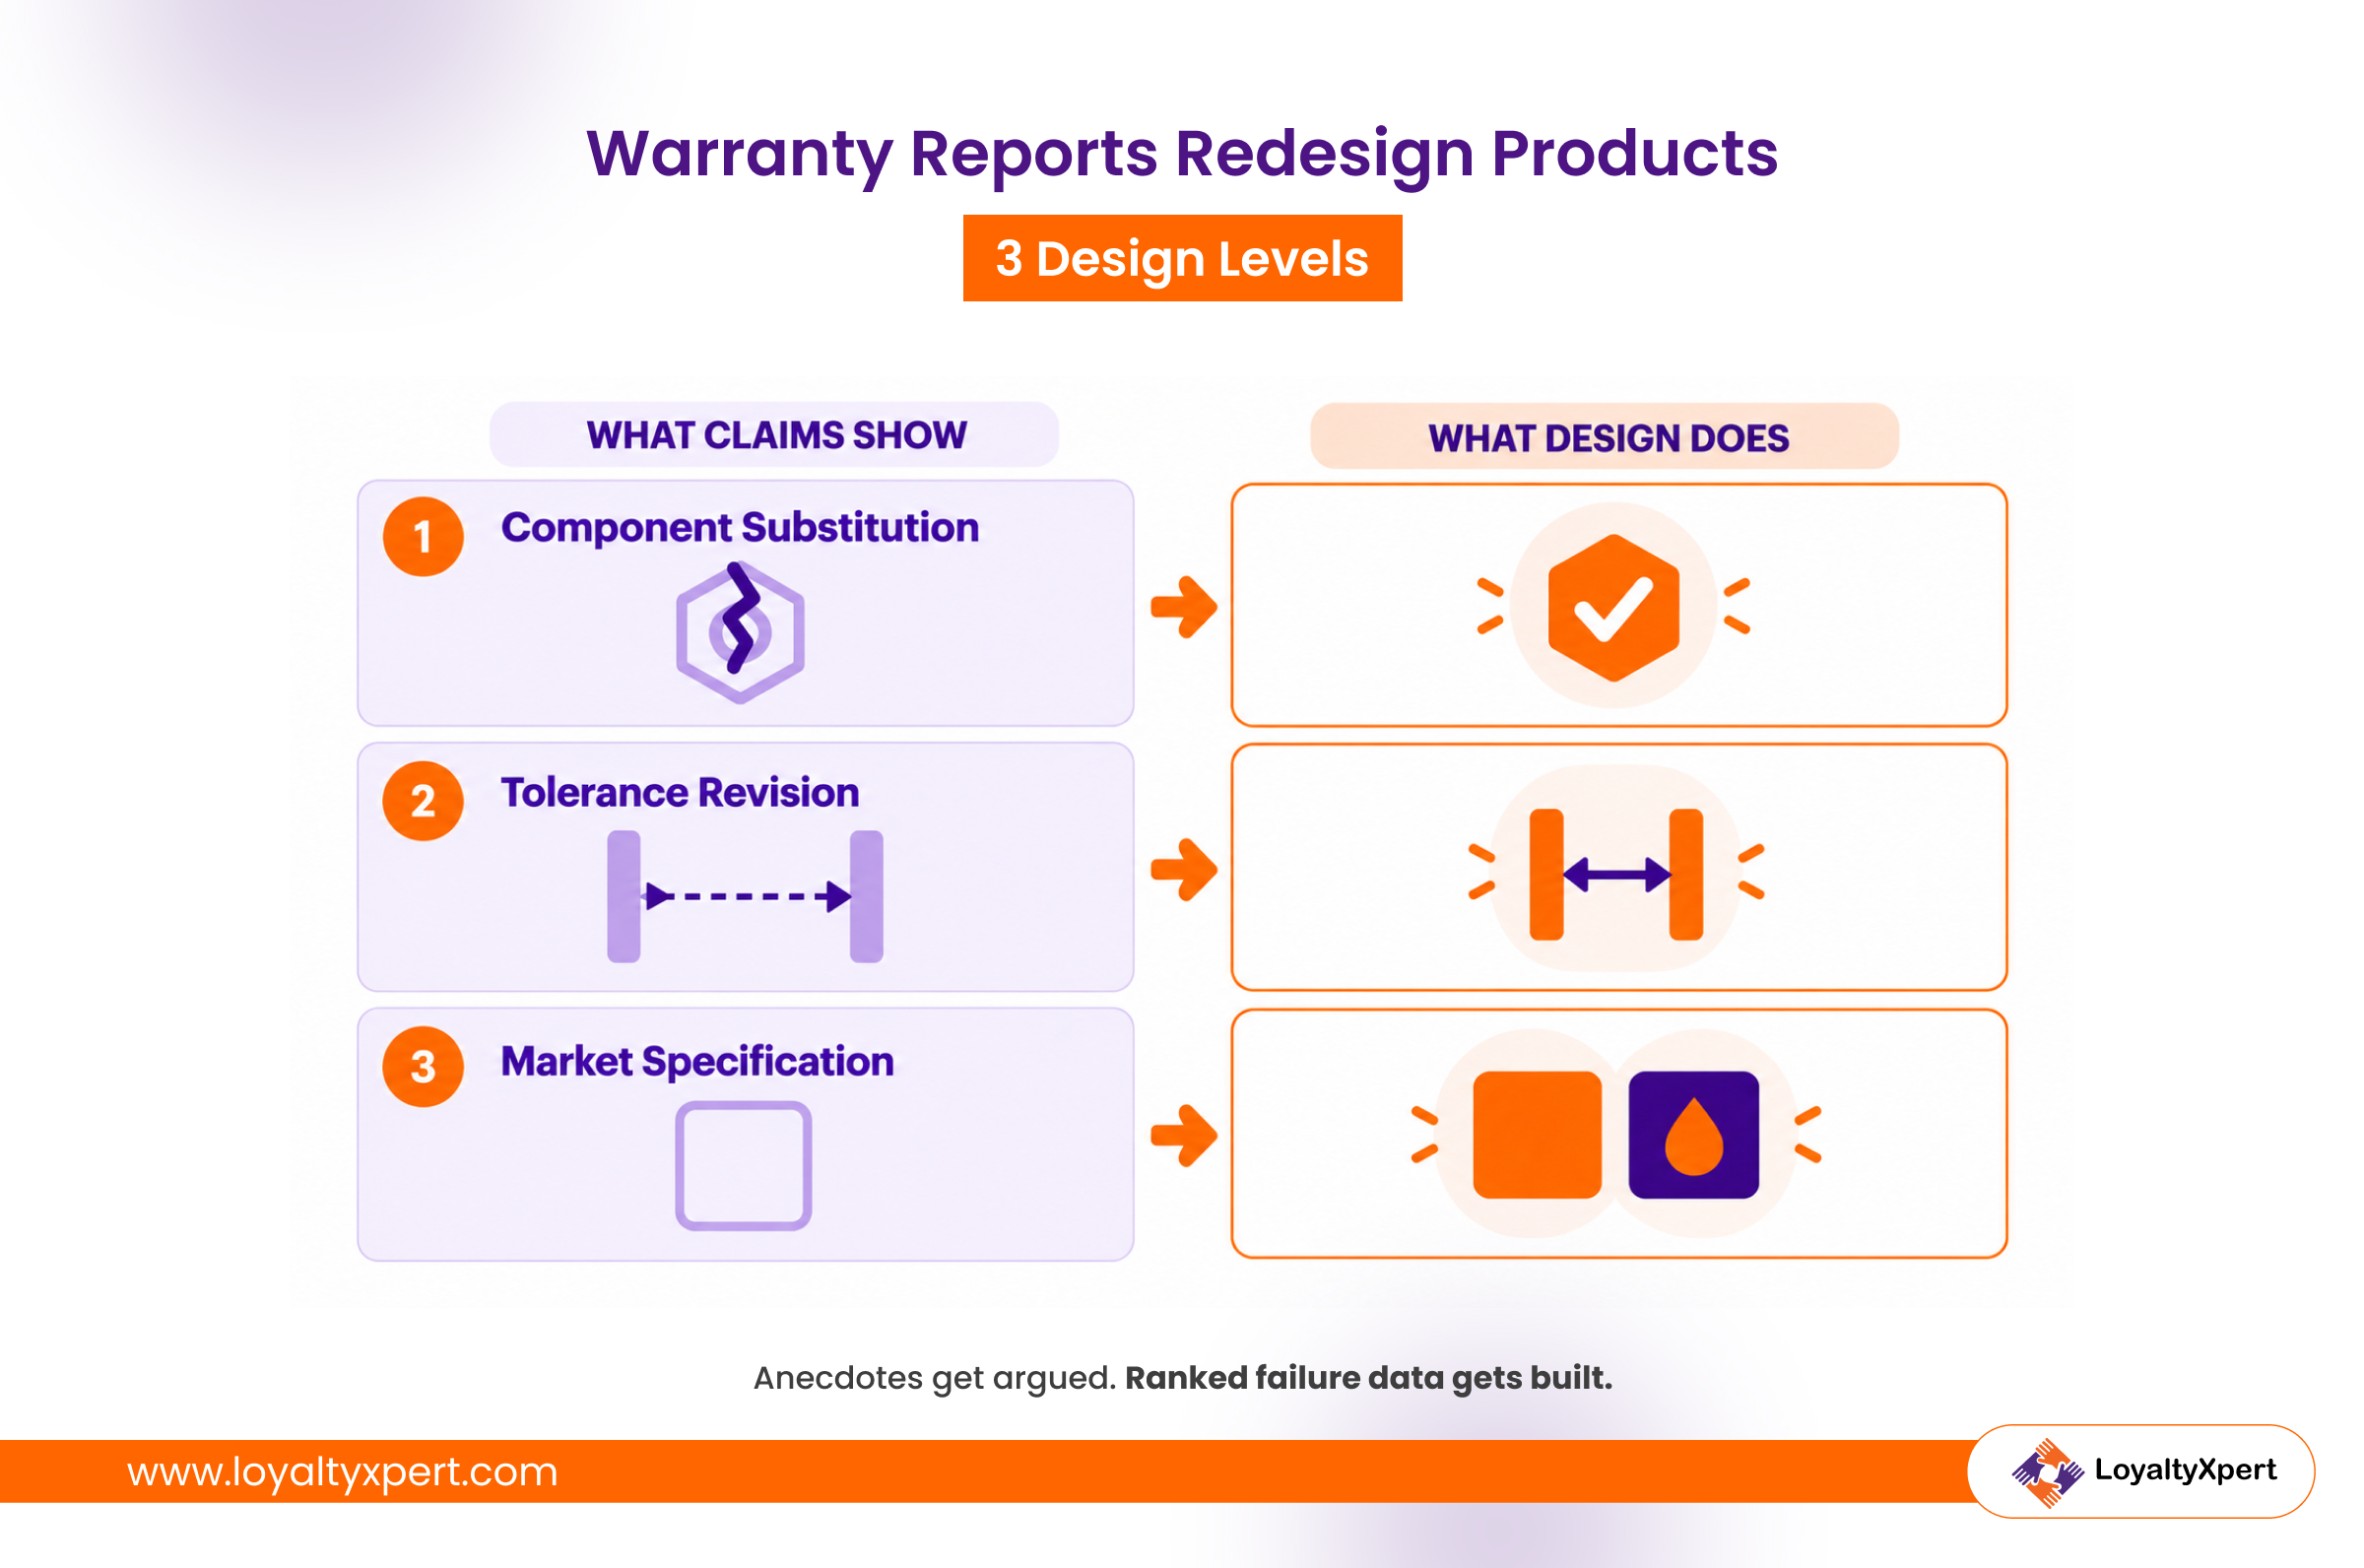
3 ways warranty data shapes design decisions:
1. Component Substitution
Recurring seal failures justify a better-grade material. The claim cost per unit proves the business case.
2. Tolerance Revision
Assembly-linked failures point to tight or loose tolerances. Engineers adjust specifications with evidence.
3. Specification Change By Market
Coastal claims justify better coating for coastal stock. Product warranty management software makes the regional split visible in the first place: one product, two specifications, lower total cost.
Design teams often resist anecdotal complaints. They accept ranked data, and a warranty management system supplies exactly that, revision after revision.
Which Warranty Reports Should Manufacturers Track?
Manufacturers should track six core Warranty Management Reports. These cover volume, cost, failure, speed, geography, and dealer behavior. Each report answers one operational question. Together they give a full quality picture. An online warranty management system can schedule all six automatically. Reviewing them monthly keeps issues small, while reviewing them quarterly lets defects spread.
6 reports that belong on every quality dashboard:
| Report | Question It Answers |
|---|---|
| Claim Trend Report | Are claims rising or falling? |
| Failure Rate Report | Which components fail most often? |
| Product-Wise Claim Report | Which models carry the highest risk? |
| Turnaround Time Report | How fast do we settle claims? |
| Geographic Claim Report | Where do conditions damage products? |
| Dealer Claim Report | Which dealers file unusual claim volumes? |
Do not treat the turnaround report as an admin metric. Settlement speed is what dealers actually judge you on, which makes it one of the clearest links between warranty management software and customer retention.
Every claim holds valuable insights. Start learning from them.
That last report deserves attention. Unusual dealer patterns sometimes signal fraud, and sometimes they signal nothing worse than poor installation training. An online warranty management system separates the two quickly, which matters when the same partners sit inside your dealer loyalty program.
Wrapping Up
Warranty data is not an accounting burden. It is the most honest feedback you receive. Customers tell you exactly what broke. Dealers tell you exactly where. Reports tell you exactly how often.
Manufacturers who read that signal ship better products. They catch defects before recalls arrive. They negotiate harder with suppliers. They design smarter next revisions. That is precisely how warranty reports improve product quality.
The shift needs structure, not more effort. A single warranty management system does the work. Warranty tracking software captures claims, codes defects, and delivers reports on schedule. Your teams simply act on them.
Ready to turn warranty claims into quality insight?
- Book a Demo — See how warranty reporting works on live dealer data.
- Contact Us — Discuss your claim volumes and reporting gaps with our team.
- Explore LoyaltyXpert — Review the full B2B channel management platform.
- Become a Partner — Bring structured warranty and channel loyalty programs to your clients.